
11 February will mark 127 years since the UK’s joint-lowest temperature was recorded, at Braemar in Scotland. The record low figure of -27.2°C has been equalled twice, but never exceeded, in all instrumental records since the mid-19th century. It remains one of the longest-standing national records in the Met Office archives.
In the 127 years since 11 February 1895, the record low figure of -27.2°C has been reached a further two times, once in Braemar on 10 January 1982 and again on 30 December 1995 at Altnaharra.
The 1895 record is the second-oldest individual national temperature record still standing and, in the context of warming global climate, raises an interesting question on the likelihood of seeing temperatures so low again in the UK.
Of course, UK weather is notoriously erratic, capable of balmy days in the summer heat and bone-chilling cold snaps in the winter. However, when looking at the UK individual national records for temperature extremes, three countries (England, Scotland and Northern Ireland) have broken their highest maximum temperature record since the year 2000. However, for lowest minimum temperatures, only Northern Ireland has broken a national record since 2000, when it got to -18.7°C in 2010.
In the context of a changing climate, daily temperature records in any year are just one part of the picture. An overall warming global climate is evident, indeed, the warmest seven years globally have all been since 2015, but what does this long-term warming trend mean for breaking individual, daily low temperature records?
11 February, 1895

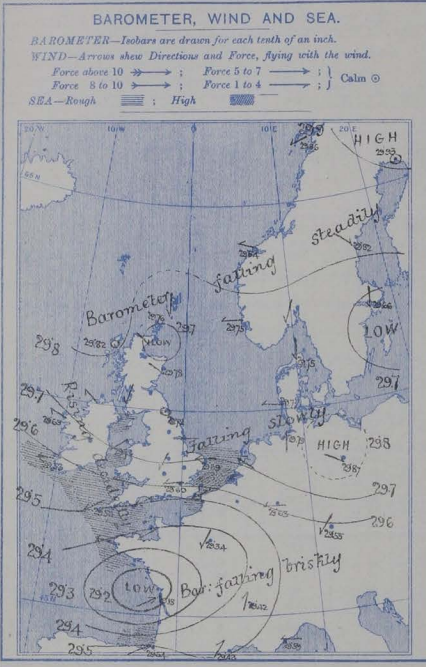
The weather set-up for the UK’s joint-lowest temperature on record is certainly not an unfamiliar one, albeit more extreme than most.
A very cold easterly flow controlled the weather over the UK and most of Europe for much of the month, with some heavy snow showers reported in northern areas early on in February. The easterly wind and a shallow low-pressure system centred over the north of the UK saw temperatures plunge for a prolonged period. It’s a fairly familiar weather pattern for the UK, and is frequently referred to as a ‘Beast from the East’, although this one had less widespread snow than the 2018 snow and low temperatures.
However, beyond the initial snow in the north, February 1895 was a dry and clear month, which locked in very low temperatures overnight with some harsh frosts.
Digging into the Met Office archives, Symons’s Monthly Meteorological Magazine published a letter at the time that stated, “The great frost seems to have broken up, but it will long be remembered. From December 30th to February 27th (60 days) the thermometer fell below 32°F [0°C] every night except four.”
A frosty picture
One indicator of cold conditions is frost, so a way of looking at trends in spells of cold and wintry weather is to delve into the statistics to look at average number of frost days for the UK in a year.
Air frost, which is when the air temperature falls below 0°C as measured one metre above the ground, has been occurring less regularly in a UK series which begins in 1960. Looking at 30-year meteorological averaging periods, the 1961-1990 average number of air frosts in a year in the UK was 64 days. The current averaging period, which is from 1991-2020, shows an average of 53 days of air frosts.

It’s a very similar picture for the prevalence of ground frost, which refers to the formation of ice on the ground, objects or trees.
The 1961-1990 average number of ground frosts in the UK was 118. Fast-forward to the latest averaging period of 1991-2020, and it’s down to 102.

However, it is still possible for temperatures as low, or indeed lower than -27.2°C to occur at some point. What it does show is that below-freezing conditions in general are becoming less frequent in the UK on a globally warming planet.
Dr Mark McCarthy of the National Climate Information Centre said, “Record-breaking temperature extremes are, by their very nature, sporadic. Declining frosts are a symptom of a warming global trend, and that same warming trend is responsible for making extreme cold less likely in the UK.
“The variability of the weather in the UK is demonstrated in the lowest minimum temperature record. Despite a long-term warming trend, the record low figure of –27.2°C has been hit a further two times, showing that extremes of cold are still possible on a warming planet, even if it’s becoming slightly less likely.
“What the long-term frost data shows us is another indicator of how a warming planet influences conditions and shifts averages. For frosts, it shows us less frequent frosts, which, in effect, shows there are fewer opportunities for record breaking low temperatures.”
Average minimum temperature
Annual average minimum temperatures have also been increasing in a series which dates back to 1884. The 1961-1990 average annual minimum temperature was 4.8°C, while for 1991-2020 the figure is 5.5°C.

“The warming trend globally has shifted average UK temperatures up, and that’s no different when it comes to minimum temperatures,” explained Mark.
“Like all averages, this doesn’t mean extreme minimum temperatures are impossible, but it does change the context of the climate and reduces the chances of extreme low temperatures.”
Find out more about climate change’s influence on UK meteorological averages and the change to the latest averaging period.
You can access an archive of meteorological magazines on the Met Office Digital Library and Archive.
View the current records and UK climate extremes on the Met Office website.

You must be logged in to post a comment.